Ultraviolet-Visible Spectroscopy
In addition to mass spectrometry, infrared spectroscopy, and nuclear magnetic resonance spectroscopy, there’s a fourth technique, ultraviolet-visible (UV-Vis) spectroscopy that can be used for structure determination. Unlike the others, this technique is only applicable to transition metal complexes and highly conjugated organic systems. UV-Vis is less common than the other three techniques because of the specialized information it gives.
Mass spectrometry —> Molecular size and formula
IR spectroscopy —> Functional groups present
NMR spectroscopy —> Carbon-hydrogen framework
UV-Vis spectroscopy —> Nature of conjugated pi electron system
Ultraviolet and visible spectroscopy measures the absorption, transmission and emission of ultraviolet and visible light wavelengths by matter.
In the chemistry laboratory, ultraviolet and visible spectroscopy are used to study molecules and ions in solution. Although the ultraviolet and visible regions of the electromagnetic spectrum are distinct, they are linked in UV-Vis spectroscopy in that the same research techniques and tools can be used for both regions.
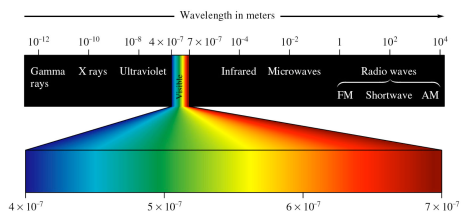
Figure 1: Within the electromagnetic spectrum, ultraviolet (UV) radiation has wavelengths of 200-400nm while visible light has wavelengths of 400-800nm.
Ultraviolet and visible light are of a higher frequency, and therefore of higher energy, than infrared, microwave and radio waves.
The ultraviolet band of the electromagnetic spectrum is further separated into three regions termed UV-A, UV-B and UV-C. Although not all scientists agree on the exact division of these wavelengths, UV-A is generally considered to be light with wavelengths between 320-400 nm; UV-B wavelengths are generally considered to be those between 290-320nm; and UV-C wavelengths usually fall between 200-290 nm.