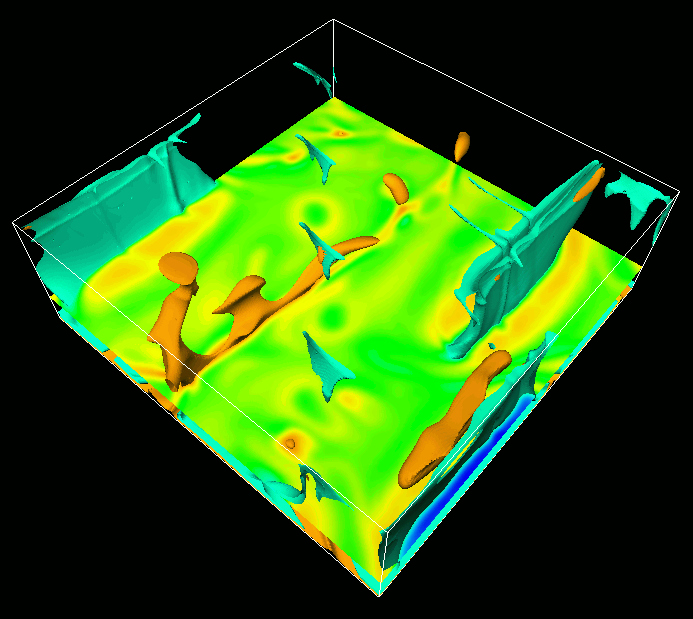
Animation 1: (From Lowman, King and Gable G-cubed 2004)
Animation 2: (From Lowman, King and Gable G-cubed 2004)
Animation 3: Temperature field evolution in Model 30b. The calculation has periodic (wrap-around) boundary conditions and incorporates four plates with thicknesses of 0.052d (150 km). The Rayleigh numbers specified for the calculation (based on the lower mantle viscosity) are Ra_B=1.666e6 and Ra_H=2.5e7. Viscosity decreases by a factor of 30 above a depth of 0.22d (670 km). The blue isosurface has a temperature of 0.65 and the orange isosurface has a temperature of 0.85. The blue isosurface is cropped at a depth of 0.069d (200 km). The color legend to the lower right indicates the colour palette used in the animation. The co-ordinate axes to the lower left indicate the orientation of the depicted temperature field relative to other animations from this model. The surface plate geometry is indicated at the upper left with a numerical referencing system. Plate velocity is also shown to the upper right with arrows superimposed on each plate to indicate the instantaneous direction of plate motion above the temperature field. Arrow lengths are time-dependent and are proportional to plate velocity magnitude as indicated by the velocity scale. Time passage is indicated at the bottom of the figure. Calculations were performed on a 16 processor Beowulf cluster and required approximately 1 Gigabyte of RAM per process. Each calculation is computed on a 325 x 325 x 129 node grid and models a volume with physical dimensions of 3 x 3 x 1.
Animation 4: Temperature contour evolution at a depth of 0.067d (200 km) in Model 30b. The contour interval is 0.01. Contours are shown in the ranges 0.0-0.65 (blues) and 0.85-1.0 (oranges and reds).
Animation 5: Temperature field evolution in Model 9b. The calculation has periodic (wrap-around) boundary conditions and incorporates four plates with thicknesses of 0.052d (150 km). The Rayleigh numbers specified for the calculation (based on the lower mantle viscosity) are Ra_B=1.666e6 and Ra_H=2.5e7. Viscosity decreases by a factor of 9 above a depth of 0.22d (670 km). The greenish-blue isosurface has a temperature of 0.69 and the orange isosurface has a temperature of 0.89. The blue isosurface is cropped at a depth of 0.069d (200 km). The color legend to the lower right indicates the colour palette used in the animation. The co-ordinate axes to the lower left indicate the orientation of the depicted temperature field relative to other figures and animations from Model 9b. The surface plate geometry is indicated at the upper left with a numerical referencing system. Plate velocity is also shown to the upper right with arrows superimposed on each plate to indicate the instantaneous direction of plate motion above the temperature field. Arrow lengths are time-dependent and are proportional to plate velocity magnitude as indicated by the velocity scale. Time passage is indicated at the bottom of the figure. Calculations were performed on a 16 processor Beowulf cluster and required approximately 1 Gigabyte of RAM per process. Each calculation is computed on a 325 x 325 x 129 node grid and models a volume with physical dimensions of 3 x 3 x 1.
Animation 6: Temperature contour evolution at a depth of 0.083d (250 km) in Model 9b. The contour interval is 0.01. Contours are shown in the ranges 0.0-0.69 (blues) and 0.89-1.0 (oranges and reds).
Animation 7: Temperature field evolution in Model 90b. The calculation has periodic (wrap-around) boundary conditions and incorporates two plates with thicknesses of 0.052d (150 km). The Rayleigh numbers specified for the calculation (based on the lower mantle viscosity) are Ra_B=1.666e6 and Ra_H=2.5e7. Viscosity decreases by a factor of 90 above a depth of 0.22d (670 km). The blue isosurface has a temperature of 0.61 and the yellow isosurface has a temperature of 0.81. The blue isosurface is cropped at a depth of 0.069d (200 km). The color legend to the lower right indicates the colour palette used in the animation. The co-ordinate axes to the lower left indicate the orientation of the depicted temperature field relative to other figures and animations from Model 90b. The surface plate geometry is indicated at the upper left with a numerical referencing system. Plate velocity is also shown to the upper right with arrows superimposed on each plate to indicate the instantaneous direction of plate motion above the temperature field. Arrow lengths are time-dependent and are proportional to plate velocity magnitude as indicated by the velocity scale. Time passage is indicated at the bottom of the figure. Calculations were performed on a 16 processor Beowulf cluster and required approximately 1 Gigabyte of RAM per process. Each calculation is computed on a 325 x 325 x 129 node grid and models a volume with physical dimensions of 3 x 3 x 1.
Animation 8: Temperature contour evolution at a depth of 0.067d (200 km) in Model 90b. The contour interval is 0.01. Contours are shown in the ranges 0.0-0.61 (blues) and 0.81-1.0 (yellows, oranges and reds).
Julian Lowman, Department of Physical and Environmental Sciences, University of Toronto at Scarborough, 1265 Military Trail, Toronto, ON, Canada, M1C 1A4
tel: (+1) 416 208 4880; fax: (+1) 416 287 7279; e-mail: lowman@utsc.utoronto.ca
Return to the Physical and Environmental Sciences Home Page, the Department of Physics home page or the Department of Astronomy and Astrophysics home page.