What does UV spectroscopy measure?
In the practical sense, spectroscopy measures the absorption, emission, or scattering of electromagnetic radiation by atoms or molecules. By such measurements, the type of the atoms or molecules present in a sample, as well as a measure of their concentration or abundance, can be made with a high degree of accuracy.
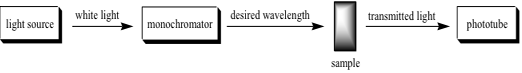
When ultraviolet or visible light strikes an atom or molecule, it can either be transmitted or absorbed; the energy absorbed corresponds to the amount necessary to promote an electron from a low energy orbital to a higher energy orbital.
A diagram showing the various kinds of electronic excitations that may occur in organic molecules is shown below. Of the six transitions outlined, only the two lowest energy ones n → π* and π → π* are achieved by the energies available in the 200 to 800 nm spectrum. As a rule, energetically favored electron promotion will be from the highest occupied molecular orbital (HOMO) to the lowest unoccupied molecular orbital (LUMO), and the resulting species is called an excited state.
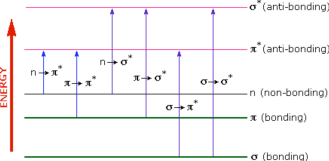
Figure 2: Various electronic excitations
An example of electron excitation can be seen from the irradiation of 1,3-butadiene with UV light of continuously changing wavelength. 1,3-butadiene contains two conjugated double-bonds from four sp2 hybridized carbon atoms, each contributing a p atomic orbital with one electron (has four π molecular orbitals). According to molecular orbital theory, which places a compound’s electrons in their corresponding energy levels, 1,3-butadiene has two lower-energy, bonding MOs in the ground state (π1 and π2) and two higher-energy, antibonding MOs that are unoccupied (π3* and π4* star). See Figure 3. The UV energy that corresponds to the energy change required for promotion of an electron from a bonding π molecular orbital to an antibonding π* molecular orbital (from HOMO to LUMO) has a wavelength of 217nm (for 1,3-butadiene). Ultimately, one electron from π2 (HOMO) transitions to fill π3* (LUMO) which results in the excited-state electronic configuration of 1,3-butadiene.
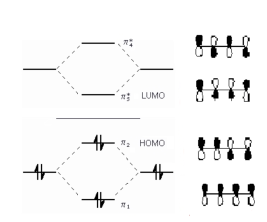
Figure 3: Molecular orbital diagram for 1,3-butadiene.
The horizontal center line denotes the energy
of a carbon atomic p orbital. Orbitals below that line are bonding those above are anti-bonding. The highest
occupied molecular orbital (HOMO) is π2 and the antibonding π* orbitals contain no electrons; the lowest
unoccupied molecular orbital (LUMO) is π3*.
When sample molecules are exposed to light having an energy that matches a possible electronic transition within the molecule, some of the light energy will be absorbed as the electron is promoted to a higher energy orbital. An optical spectrometer records the wavelengths at which absorption occurs, together with the degree of absorption at each wavelength. The resulting spectrum is presented as a graph of absorbance (A) versus wavelength, as in Figure 4 shown below. Absorbance is defined as A = logI0/I where I0 is the intensity of the light before passing through the sample and I is the intensity of the light after passing through the sample. Absorbance values typically range from 0 (no absorption) to 2 (99% absorption), and are precisely defined in context with spectrometer operation.
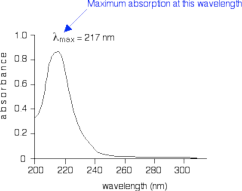
Figure 4: Simplified UV-Visible absorption spectrum for 1,3-butadiene.
The absorption peaks at 217nm, which
is in the ultraviolet range and not in the visible range. This corresponds to a π → π* transition. UV spectra
graphs usually display a single peak as opposed to the multiple absorption peaks on IR and NMR spectra. The
wavelength of the maximum absorption peak is read “lambda max”. Source: Clark, Jim (2007), retrieved online
from: http://www.chemguide.co.uk/analysis/uvvisible/theory.html
Because the absorbance of a sample will be proportional to the number of absorbing molecules in the spectrometer light beam (i.e. their molar concentration in the sample tube), it is necessary to correct the absorbance value for this and other operational factors if the spectra of different compounds are to be compared in a meaningful way. The corrected absorption value is called "molar absorptivity", and is particularly useful when comparing the spectra of different compounds and determining the relative strength of light absorbing functional groups (chromophores). Molar absorptivity (ε) is defined as ε = A /cl (also known as Beer’s Law) where:
• ε = molar absorptivity is a physical constant, unique to a sample and its own π electron system; depends on the wavelength of light
• A = absorbance
• c = concentration in mol/L
• l = sample path length in cm